Explore your data
Explore your data by creating insightful queries
SUPERWISE® offers a user-friendly query builder that provides a flexible and straightforward approach to exploring your data. With its help, you can make data-driven decisions, understand complex data sets, and convert raw data into valuable information without the need for advanced technical knowledge.
Getting started with the query builder.
Selecting a data source
Begin by choosing your data's origin:
- Dataset: Select one of the datasets created in the platform.
- Events: Data generated from activities on the platform.
Choosing the query type
Pick the type of data retrieval you require:
- Raw data: Direct data retrieval without aggregation.
- Statistics: Data retrieval with aggregation options.
- Time-series: Data analysis over specific time intervals.
- Distribution: Analyze the frequency and spread of data points.
Constructing your query
All query types will require the following basic elements:
- Time range: Select the range for your query and identify the field that will represent the time dimension.
- Fields: Select the fields from your dataset or event attributes you want to include.
Raw data query construction:
- Field selection: Determine which fields you wish to retrieve.
- Filters: Optionally, apply conditions to refine your data using fields, operators, and specified values.
- Row limitation: Optionally, set a limit to the number of rows returned.
- Visualization: View the output as a table.
Statistics query construction:
- Field and aggregate selection: Select fields you want to summarize using aggregation functions like COUNT, SUM, AVG, etc.
- Grouping: Organize your data by grouping it based on one or more selected fields.
- Row limitation: Optionally, set a limit to the number of rows returned.
- Visualization: Choose between a bar plot or a table for displaying your aggregated data.
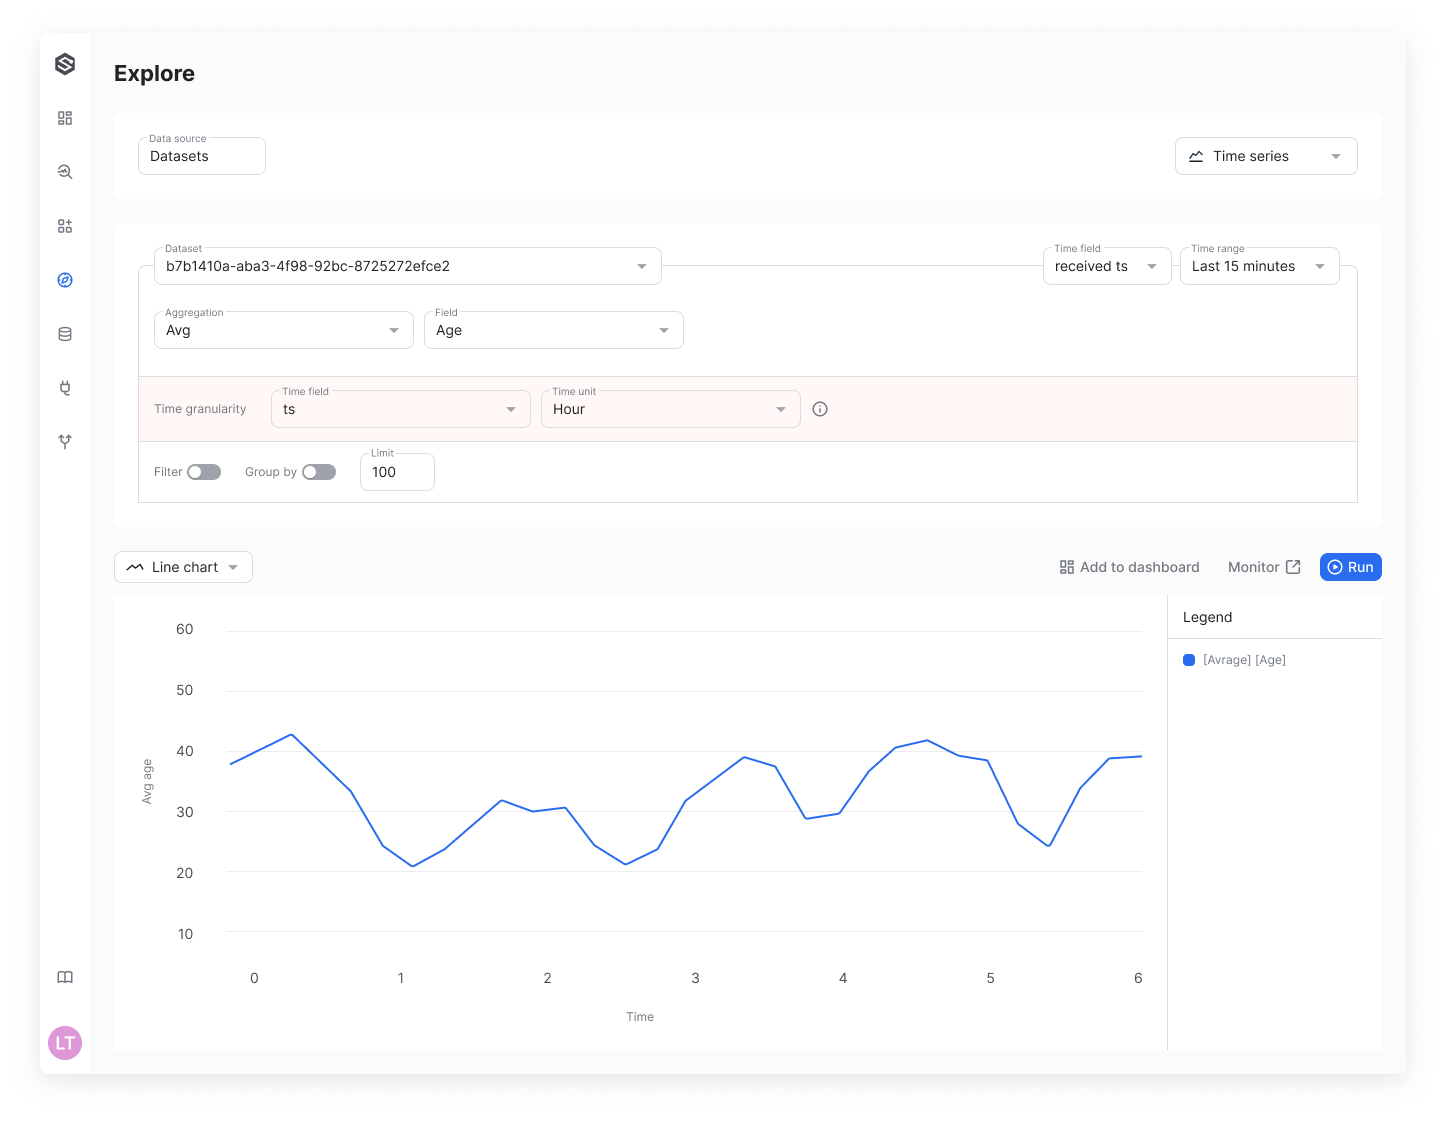
Time-series query construction:
- Field and aggregate selection: Select fields you want to summarize using aggregation functions like COUNT, SUM, AVG, etc.
- Grouping: Organize your data by grouping it based on one or more selected fields.
- Time granularity: Specify the granularity of your time analysis by choosing a time field and interval.
- Row limitation: Optionally, set a limit to the number of rows returned.
- Visualization: Present your time-sequenced data within a line chart or table format for easy trend spotting.
Distribution query construction:
- Field and aggregate selection: Select fields you want to summarize using aggregation following functions:
- Hist - for numerical fields
- Value count - for categorical fields
- Grouping: Organize your data by grouping it based on one or more selected fields.
- Row limitation: Optionally, set a limit to the number of rows returned.
- Visualization: Choose between a bar histogram or a table for displaying your aggregated data.
Compare mode:
SUPERWISE® enables you to compare two distributions easily using the "compare" button.
Pay attention!
The compare function can only be applied to two fields of the same type (e.g., numbers, strings, etc.).
There are two ways to utilize the compare mode:
- Plain Comparison: Simply compare two distributions to visually inspect and analyze them side by side.
- Comparison with a Distance Function: Compare two distributions and measure the distance between them to calculate a drift metric. This approach helps quantify the difference between distributions, providing a concrete measure of drift. For more information, read how to calculate drift metrics.
Running your query
To execute your query, click the "Run" button. Your results will appear in the selected visualization format, providing you with the insights needed to make data-driven decisions
Export Results to CSV
Easily download your query results as a CSV file for seamless data analysis and sharing.
Updated 6 days ago