Create a monitoring policy
SWE allows your team to proactively oversee and ensure the performance of your AI models. This is essential for maintaining the integrity and reliability of your models in production. The following documentation guides you through establishing a custom monitoring policy tailored to the unique needs of your landscape.
Using the UI
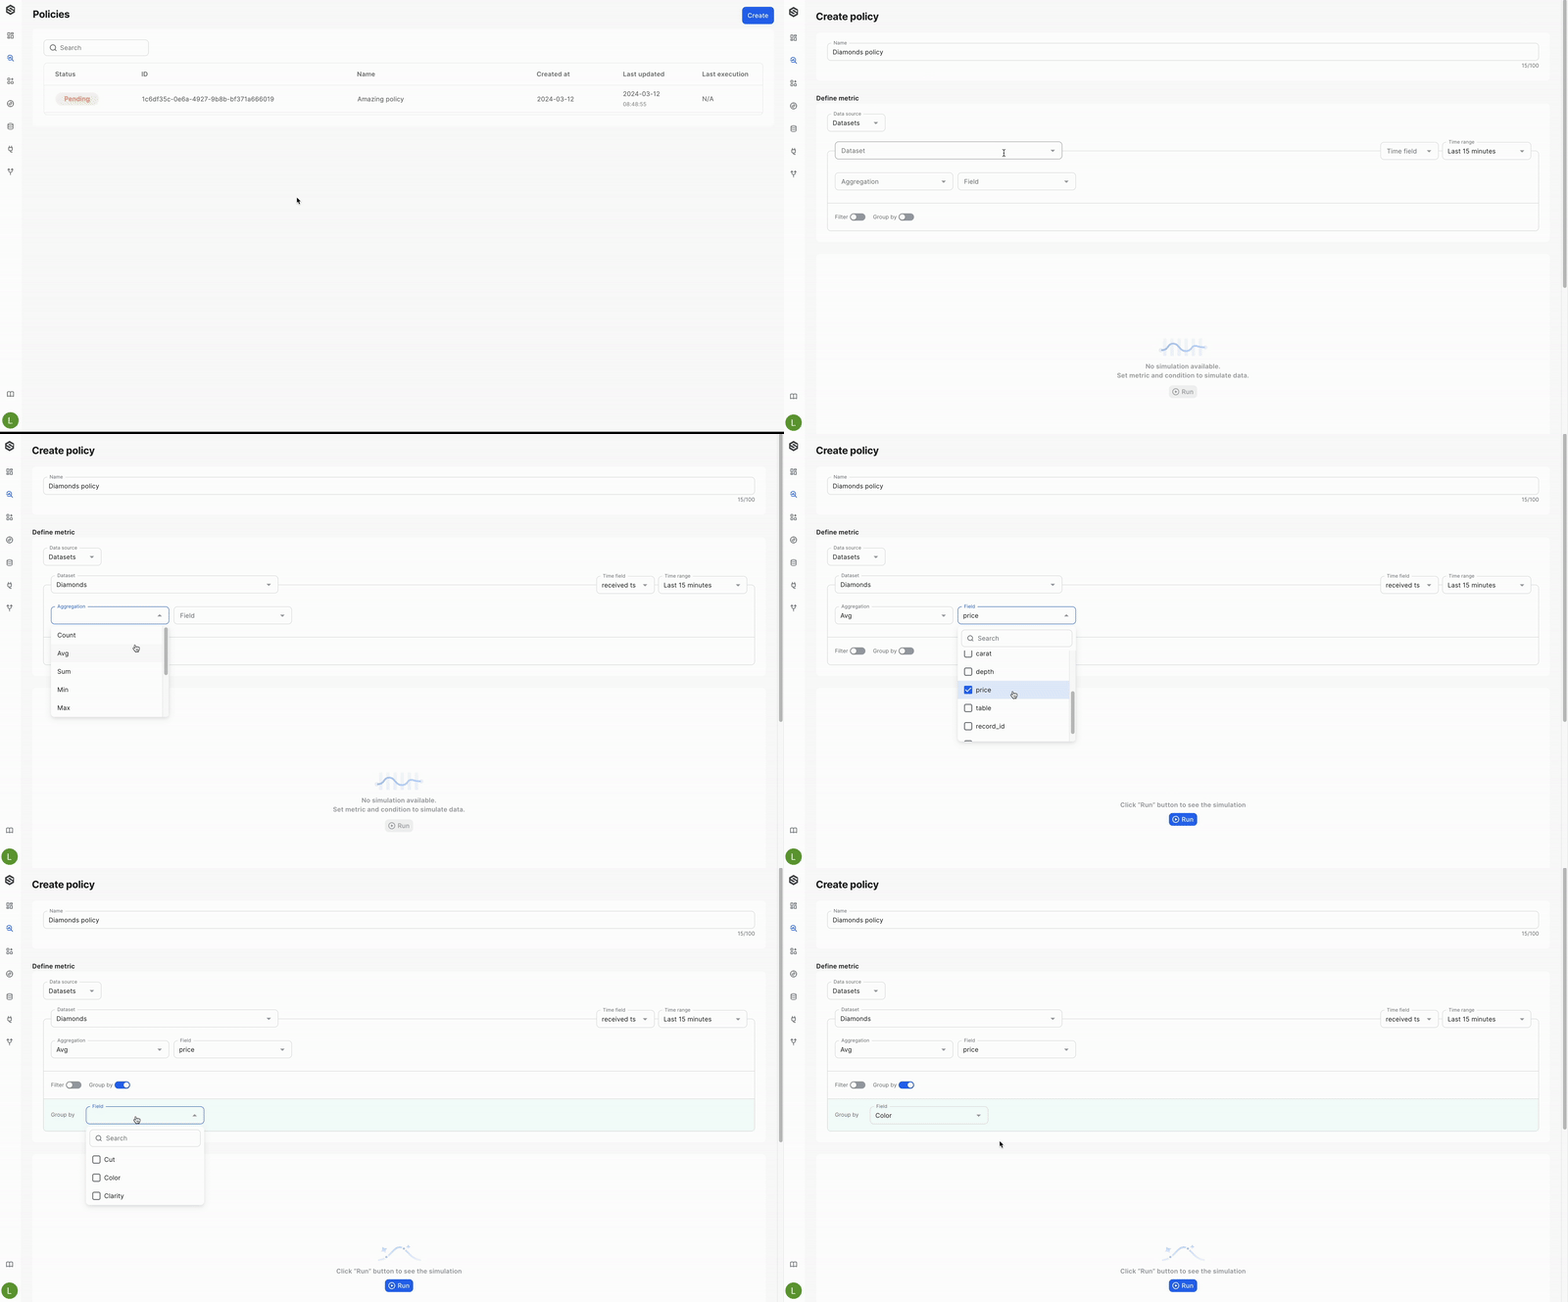
Step 1: Defining your custom metric
Every monitoring journey with SWE begins with a metric — the vital sign of your model’s health. Start by considering what you need to monitor. SWE's query builder is your tool for this job; it provides a user-friendly interface to craft custom metrics. whether you're tracking prediction accuracy, model drift, latency, or other performance indicators.

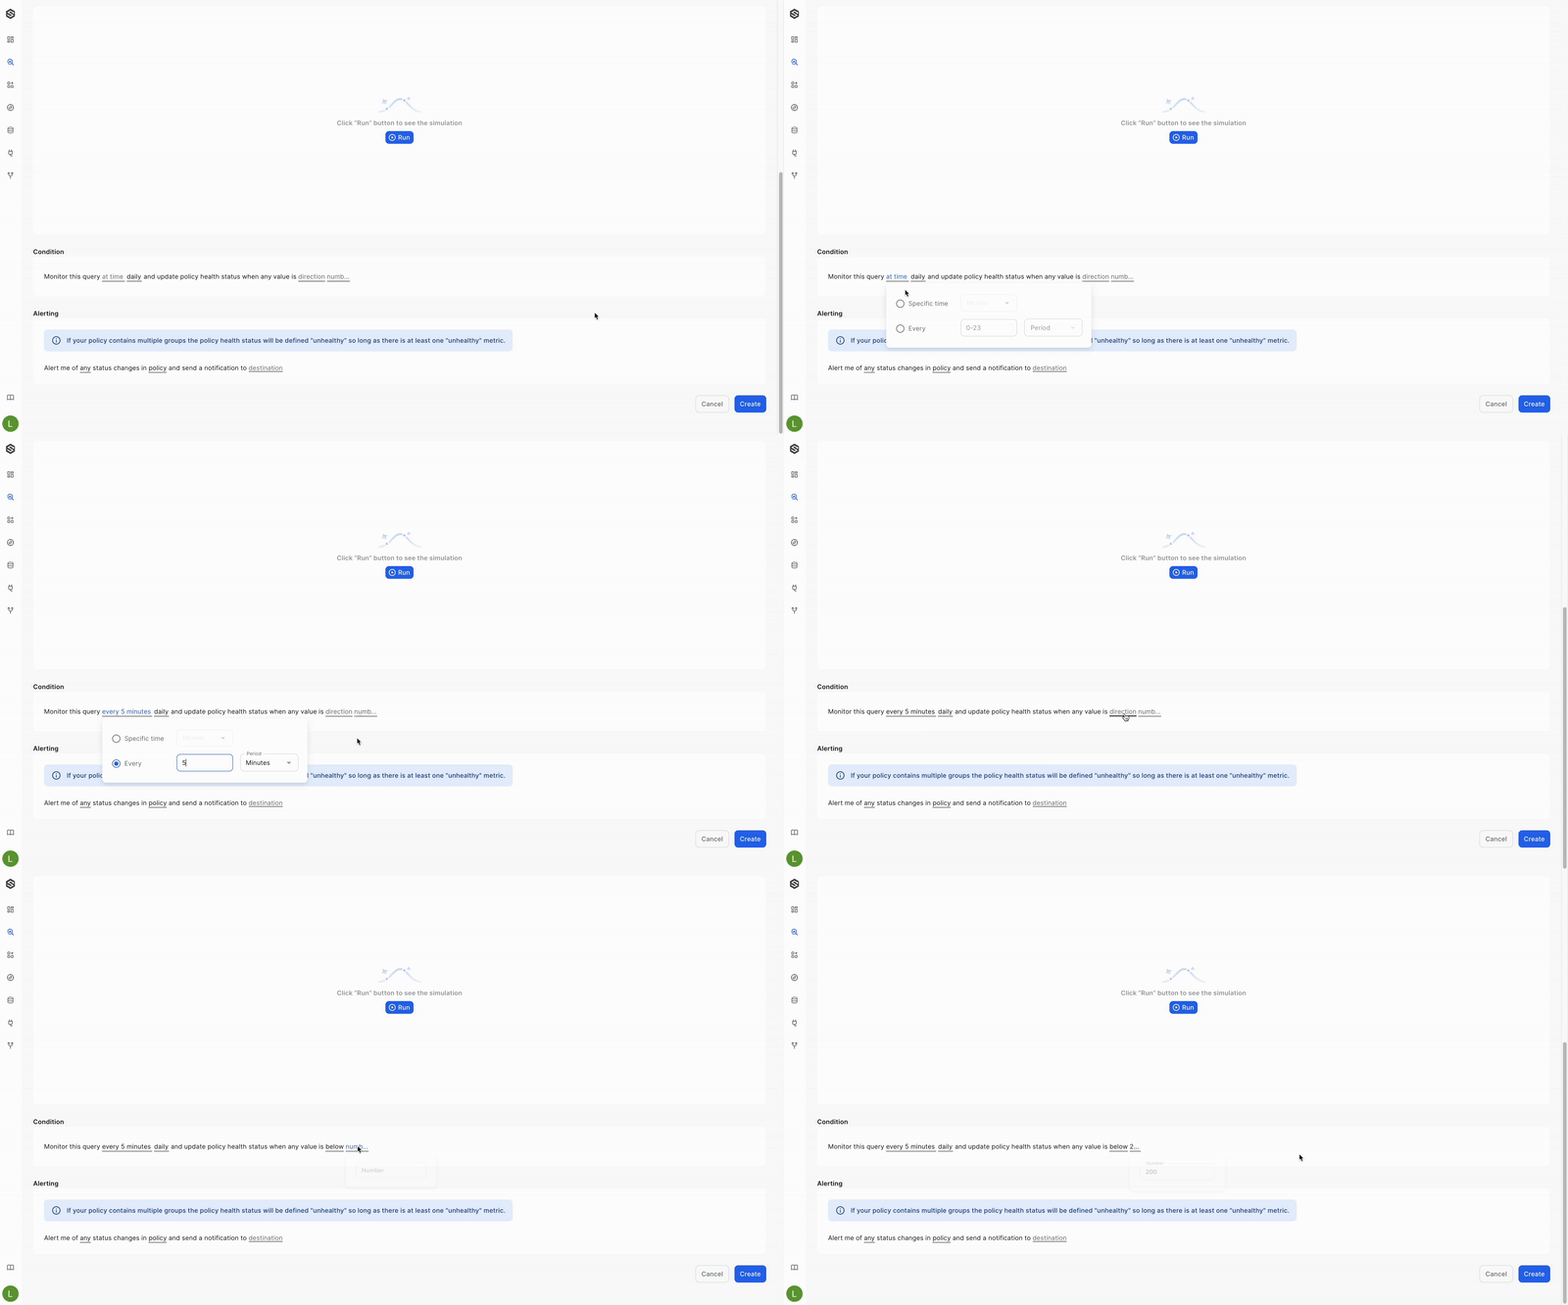
Step 2: Setting up your monitoring condition
Once your query is established, the next phase is to specify the conditions under which you desire the monitoring to take effect.
Here’s where you establish the rules:
- Threshold determination: Decide upon the numeric or categorical threshold that, when breached, signifies an anomaly.
- Frequency of monitoring: Set how often SWE should evaluate the metric against the set threshold.

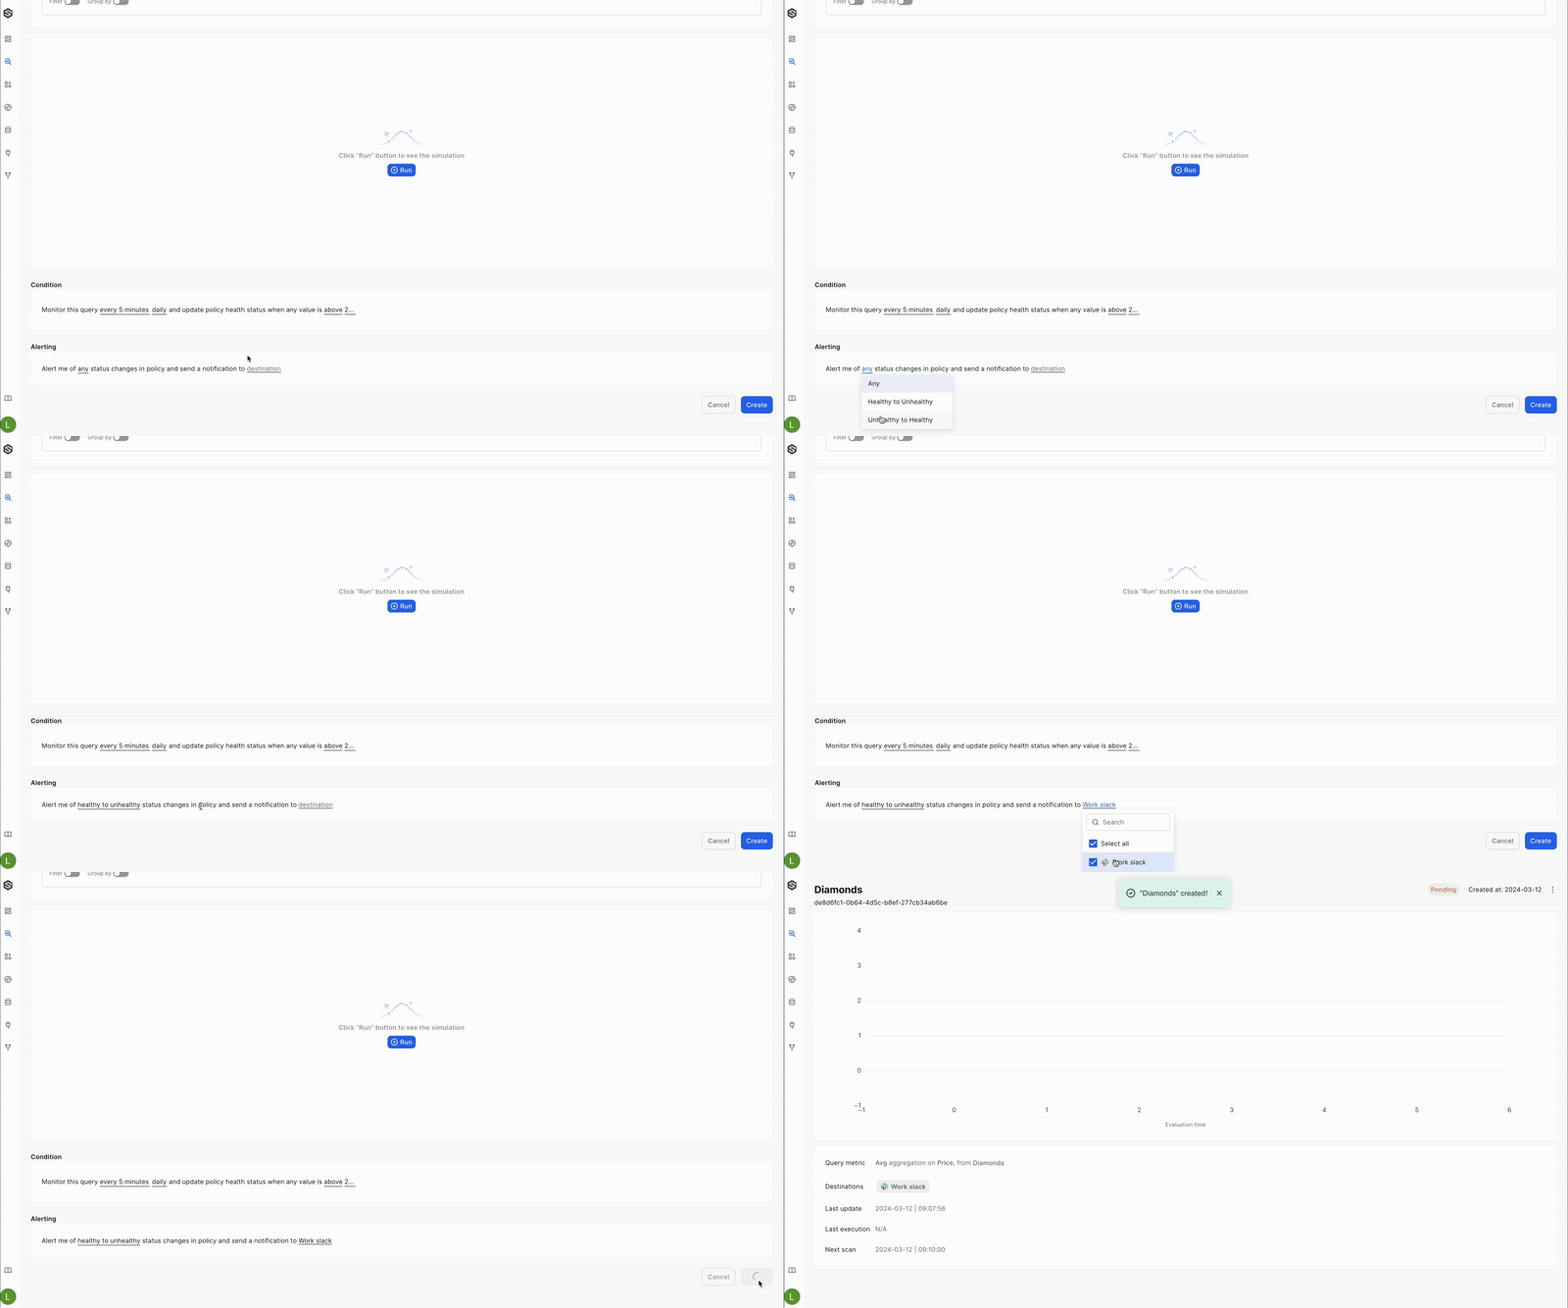
Step 3: Configuring alerts
With your policy shaped up and ready, it's time to decide on the administration of alerts:
- Alert triggers: Outline the precise conditions that will trigger an alert. This ensures that the right people get informed at the right time.
- Destination channel: Currently, SWE is designed to send alerts directly via a Slack integration. This ensures that your team is promptly notified within a familiar workspace environment for quick collaboration and resolution.

Using the SDK:
Create monitoring via the SDK include one function with multiple variables:
from superwise_api.models import PolicyCreate
from superwise_api.models import DatasetCreate

policy_payload = PolicyCreate(
        name="my_policy",
        dataset_id=dataset.id,
        query={"measures":  [f"{dataset.internal_id}.avgColumn_name"]},
        cron_expression= "2 */1 * * *",
        condition_above_value= 3.0,
        condition_below_value= None,
        alert_on_status= "HEALTHY_TO_UNHEALTHY",
        alert_on_policy_level= True,
        destination_ids= [],
        time_range_field= "ts",
        time_range_unit= "HOUR",
        time_range_value= 2
)
sw.policy.create_policy(policy_payload)
Let's elaborate on each:
- name - Assign a descriptive and unique name to your monitoring policy for easy identification.
Defining your custom metric
- dataset_id - Specify the ID of the dataset you wish to monitor.
- query - Construct a query using a list of measures in the format:
{dataset_id}.{aggregation_function}{column_name}. Adhere to these guidelines when forming a measure:- Use one of the available aggregation functions, written exactly as shown. Aggregation functions list:
count(not on a specific field),avg,max,min,sum,median,quantile25,quantile75,quantile90 - Start the column name with an uppercase letter.
- For example, to compute the average age in a dataset with the ID 12345, use:
12345.avgAge.
- Use one of the available aggregation functions, written exactly as shown. Aggregation functions list:
- time_range_field - Select the field you want to apply the time range selection on.
- time_range_value and time_range_unit - Define the time period to filter your query results by selecting a number (time_range_value) and a unit (time_range_unit) out of the following units:
MINUTE,HOUR,DAY,WEEK,MONTH
Setting up your monitoring condition
- cron_expression - Determine how frequently your policy runs by setting up a cron expression.
Cron expression
* * * * *
- Minute: Ranges from 0 to 59.
- Hour: Ranges from 0 to 23 (24-hour time).
- Day of the Month: Ranges from 1 to 31.
- Month: Ranges from 1 to 12, or you can use the three-letter abbreviation (Jan, Feb, Mar, etc.).
- Day of the Week: Ranges from 0 to 6, where 0 or 7 stands for Sunday, 1 for Monday, etc. You can also use three-letter abbreviations (Sun, Mon, Tue, etc.).
(Optional)Each field can have a specific value, a range (e.g., 2-4), a list separated by commas (e.g., 1,3,5), an asterisk (which means "any value"), or a combination of these. You can also use "/" to specify increments and "-" for ranges.
Example: The cron expression
2 /1 * * *means, run the policy at the second minute of every hour, every day, every month, and every day of the week. In other words, it will run every hour when the clock hits 2 minutes past the hour.
- condition_above_value / condition_below_value - Establish numerical limits that indicate an anomaly. Set only one parameter to define a threshold or both to establish a range. At least one of these must be set to a value other than None.
Configuring alerts
- destination_ids- Provide the IDs of the channels where you'd like to receive notifications.
- alert_on_status- Specify which state transitions should trigger an alert. Options include:
HEALTHY_TO_UNHEALTHYUNHEALTHY_TO_HEALTHYBOTH
Query Example:
Average Age Grouped by is_male, where is_male is not null, order by timestamp asc
internal_dataset_id = <your_internal_dataset_id>
query =     {
                "measures": [f"{internal_dataset_id}.avgAge"],
                "dimensions": [f"{internal_dataset_id}.is_male"],
                "filters": [
                   {
                       "member": f"{internal_dataset_id}.is_male",
                       "operator": "set",
                   }
                ],
                "order": [
                    {
                        "id": f"{internal_dataset_id}.ts",
                        "desc": false
                    }
                ]
            },
Updated over 1 year ago